Assessing Water Quality in the Stonycreek Watershed
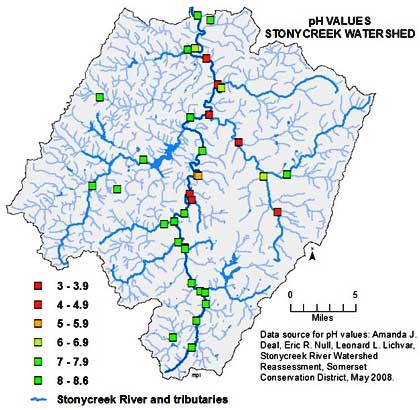
Coal had been mined commercially for nearly 75 years before there were any studies about why water quality in the Stonycreek River and its tributaries was so impaired. The first study, in 1970, documented the culprit—abandoned mine drainage—and at least nine subsequent investigations over nearly three decades merely refined the argument while expanding the number of known discharges and AML sites. Probably the US Geological Survey's (USGS) three year study, released in 1996 and by far the most comprehensive to that point, was the "game changer." It identified 270 AMD discharges in the watershed, 85 percent of which tested below Environmental Protection Agency water quality standards on one or more criteria, for pH, total iron, and total manganese. (40 of the 270 sites failed on all three counts.)


Figure 21. Stream pH is one important measure of water quality and a commonly cited indicator of a stream's health. Fish do best in water that is between 6.0 (somewhat acidic) and 8.0 (somewhat alkaline), where 7.0 is neutral. More than moderate acidity is harmful to fish reproduction and development. Data from 2008 Stonycreek River Watershed Reassessment. Map credit: Mary Lavine

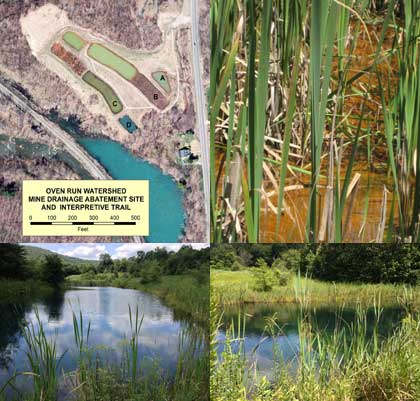
Between 1993 and 2012, through the public-private partnerships created by and coordinated through the Stonycreek-Conemaugh River Improvement Project (SCRIP), the watershed became home to nineteen passive treatment systems and two AML reclamation projects. In assessing the importance of such projects, the Somerset Conservation District's 2008 Watershed Reassessment concluded that in the intervening period (more than a decade), the Stonycreek River had changed "from a net acidic to a net alkaline stream, as a result of increased alkaline inputs from passive treatment systems." This was a good start, but not enough.


Figure 22. There are about a dozen and a half passive treatment systems for abandoned mine drainage in the Stonycreek watershed, but the one at Oven Run has something extra. Oven Run Site D, near Kantner, has interpretive signage describing the purpose of each treatment pond; the self-guided tour is open to the public. Oven Run's planning, funding, and construction were the result of a cooperative effort that included more than two dozen government agencies, non-profit organizations, private companies, and individuals. The aerial photograph, taken in April 2005, shows the path the water follows through a succession of interconnected treatment ponds, starting at the upper right (A on the map) near Route 403, and ending with water that supports trout in the "catch and release" fishing pond (D on the map). From here, the treated water is released into the Stonycreek River. Digital orthophoto image source: PAMAP Program, PA Department of Conservation and Natural Resources, Bureau of Topographic and Geologic Survey. Photo credits: Jeff Lavine

In its evaluation of the physical habitat, water chemistry, macroinvertebrates and fish populations at 35 sites along the Stonycreek River and its tributaries, the Watershed Reassessment also concluded that 18—half of the total evaluated—were "severely degraded by some combination of acidification, organic loading and physical habitat degradation." Seventeen were classified as "moderately impacted," and only four sites were judged pristine, "excellent quality streams." Agriculture and coal mining were identified as the leading causes of stream impairment.


INTERESTED IN LEARNING MORE?

To learn a great deal more about water quality assessment in the Stonycreek watershed, see Amanda Deal, Eric Null and Len Lichvar, The Stonycreek River Watershed Reassessment, Somerset Conservation District, 2008. To download this document from the Somerset Conservation District, click here.


Back to Top


Copyright ©2008 Stonycreek Quemahoning Initiative
Stonycreek-Quemahoning Initiative is a 501(c)(3) and a supporting organization of Conemaugh Valley Conservancy
Site Designed by Hurst Media Works, KH2 Design, FisherWorks Consulting and Recharge Web Design